-55-
III
PRESENT TRAFFIC CONDITIONS
1. THE BASIS OF THE ASSESSMENT
1.1 Assessment of Traffic Conditions
The Inquiry will draw upon four sources in its
assessment of present traffic conditions. The
sources are:
- Its own observations, having driven
extensively throughout the Area
during the course of the Inquiry
(in the peak and the off-peak) .
The observations were not confined
to the Study Area. They ranged
far more broadly to gain an overall
appreciation of the traffic needs
of Sydney.
- The observations of others. Of
especial importance are the obser-
vations of traffic engineers. They
are constantly assessing and
reassessing the network. They
bring to bear a trained eye. They
are devoted to the maintenance and
improvement of the system and are
skilled in identifying avenues by
which it can be made more efficient.
- The submissions to this Inquiry.
- The computer traffic modelling
technique known as the 'four-step
model' which reproduces (with the
aid of a computer) the flow of
traffic throughout the network,
identifying where people wish to go
and where congestion is likely to
be experienced
-56-
The foregoing analysis makes it clear that an
identification of congested links (or intersections)
is the first step. Issues of policy, arising from
the interaction between land-use and transportation
planning, must then be addressed (30).
identification of congested links (or intersections)
is the first step. Issues of policy, arising from
the interaction between land-use and transportation
planning, must then be addressed (30).
Would the elimination of congestion encourage
traffic to travel in a direction in which it ought
to be discouraged? Questions of equity must also
be addressed. How does the location and extent of
congestion within the Study Area compare to the rest
of Sydney? Is it so bad, comparatively, that scarce
funds should be devoted to a major project absorbing
a large proportion of the road construction budget
for years to come?
1.2 The Public's Consciousness of Traffic as a Problem
It is impossible to live in an urban area and not
be conscious of traffic. Even in those world
cities where there is a lavish network of freeways
(and perhaps especially in those cities) the local
population is resentful of traffic's intrusion into
its daily life. The Study Area is no different. A
survey conducted by the Planning and Environment
Commission in the Botany Sub-region revealed the
following (31):
“Issues relating to traffic were
also
seen as dominant with traffic congestion
in peak hours being rated as the most
important issue by 15% of the sample
and 12% of the brochure respondents.
There was also a high percentage who
ranked it as one of the four most
important issues (36% in each survey).”
seen as dominant with traffic congestion
in peak hours being rated as the most
important issue by 15% of the sample
and 12% of the brochure respondents.
There was also a high percentage who
ranked it as one of the four most
important issues (36% in each survey).”
A large number singled out truck traffic (31):
30. See Volume II of this Report “Transport
Criteria” page 13 and see page 33 of this
Volume (Volume IV).
31. S.K/C 947 P.E.C. Appendix 6, page 4.
Criteria” page 13 and see page 33 of this
Volume (Volume IV).
31. S.K/C 947 P.E.C. Appendix 6, page 4.
-57-
"A related issue to emerge as
impor-
tant was that of increase in truck
traffic. 10% of sample and 6% of
brochure respondents listed it as
the most important issue. It also
received a high percentage from those
who thought it to be one of the four
most important issues (35% in the
sample and 37% in the brochure)."
tant was that of increase in truck
traffic. 10% of sample and 6% of
brochure respondents listed it as
the most important issue. It also
received a high percentage from those
who thought it to be one of the four
most important issues (35% in the
sample and 37% in the brochure)."
2. WHERE ARE THE TRAFFIC PROBLEMS?
2.1 The URTAC Report of February, 1976
In February, 1976 the Urban Transport Advisory
Committee of New South Wales (URTAC) published
a report. The Report was concerned to identify
existing problems and formulate a programme 'designed
to improve what we have got rather than recommend
a programme which, while spectacular in concept,
would be incapable of achievement in practical
terms' (32).
It considered the Sydney metropolitan road network
region-wide. It was concerned with congestion. The
following is obviously a broad brush description.
It is nonetheless instructive. The report reads (33):
region-wide. It was concerned with congestion. The
following is obviously a broad brush description.
It is nonetheless instructive. The report reads (33):
"The most extensive
congestion, both
in peak and off-peak periods, however,
is now occurring in the mid-western
parts of the region, notably in the
area bounded by Bankstown – Liverpool -
Fairfield - Parramatta - Ryde and
Homebush and in pockets of the closer
southern and inner western suburbs.
The eastern part of the region has
survived on the fat of road capacity
planned and constructed in earlier
days but what little of the planned
construction for the western suburbs
has come to fruition has not generally
been able to match the rapid growth in
this area. "
(emphasis added)
The New South Wales Government has recently (November
1980) identified the Western Region as an area in
need of transportation improvements. A number of
measures designed to improve public transport and
1980) identified the Western Region as an area in
need of transportation improvements. A number of
measures designed to improve public transport and
32. URTAC
Report February 1976, page 1.
33. ibid., page 57.
33. ibid., page 57.
-58-
road transport within the region have been devised.
The Study Area is not identified by this Report as
an area generally afflicted by severe congestion.
There are 'said to be pockets so afflicted.
an area generally afflicted by severe congestion.
There are 'said to be pockets so afflicted.
2.2 N.R.M.A. Travel Speed Assessments April, 1978
From time to time the N.R.M.A. assesses the level
of congestion on various Sydney Roads (34). The travel
times (and the travel speeds) from one point to
another are monitored. A comparison is made between
the journey times (and speeds) at different times
during the peak period.
The routes assessed are depicted in the following
diagram (Figure 6).
diagram (Figure 6).
The assessment was made at 6.45 a.m. and at 7.50 a.m.
We reproduce the table which appears in that report
(Table 1).
We reproduce the table which appears in that report
(Table 1).
The following conclusion is offered by the N.R.M.A. (35):
"Morning peak average
north-bound
traffic speeds on the four southern
routes surveyed were generally between
20 km/h and 30 km/h, except on the
General Holmes Drive route where an
average speed slightly above 30 km/h
was attained. Average speeds between
30 km/h and 40 km/h are generally
considered acceptable for urban
arterials."
traffic speeds on the four southern
routes surveyed were generally between
20 km/h and 30 km/h, except on the
General Holmes Drive route where an
average speed slightly above 30 km/h
was attained. Average speeds between
30 km/h and 40 km/h are generally
considered acceptable for urban
arterials."
Elsewhere in the Report the following is said (36):
"The congestion levels on the
Bay
Street-Fitzroy Street section of the
General Holmes Drive Route, the Bay
Street to Carillon Avenue section of
the Princes Highway Route, the Bexley
Road to Cleveland Street section of
the Qantas Drive Route and the Kingsgrove
Road/William Street to Carillon Avenue
section of the Illawarra Road Route
34. Travel
Speeds on Four Southern Routes in Sydney,
Bruce Searles N.R.M.A April, 1978, Appendix 1.
35. ibid., page 10.
36. ibid., page 2.
Bruce Searles N.R.M.A April, 1978, Appendix 1.
35. ibid., page 10.
36. ibid., page 2.
-59-
FIGURE 6.
SOUTHERN
SURVEY ROUTES

-60-
TABLE 1.
SOUTHERN
ROUTES TRAVEL TIMES AND SPEEDS
RUN START TIME
|
6.45 A.M.
|
7.50 A.M.
|
||||
ROUTE SECTION
|
MEAN TIME
(min)
|
VARIANCE
(min2)
|
MEAN SPEED (km/h)
|
MEAN TIME
(min)
|
VARIANCE
(min2)
|
MEAN SPEED (km/h)
|
1. General Holmes Drive Route
|
||||||
2
a. The Boulevarde to Fitzroy Street
(22.35 km) |
30.1
|
3.9
|
44.6
|
43.4
|
23.0
|
30.9
|
3
b. Bay Street to Fitzroy Street (12.58 km)
|
16.3
|
1.6
|
46.3
|
24.7
|
17.4
|
30.6
|
2. Princes Highway
|
||||||
4
a. Corea Road to 27.8Carillon Avenue
(17.49 km) |
27.8
|
8.9
|
37.7
|
41.1
|
11.9
|
25.5
|
5
b. Bay Street to Carillon Avenue (8.99 km)
|
16.5
|
8.1
|
32.7
|
23.6
|
6.1
|
22.9
|
3. Qantas Drive Route
|
||||||
6
a. Forest Road/ Henry Lawson Drive to Regent Street/Cleveland
Street (18.97 km)
|
34.6
|
19.5
|
32.9
|
45.81
|
12.5
|
24.9
|
7
b. Bexley Road to Cleveland Street
(12.10 km) |
23.7
|
19.7
|
30.6
|
32.1
|
7.9
|
22.6
|
4. Illawarra Road Route
|
||||||
8
a. Broadarrow Road to Erskineville Road (14.58 km)
|
28.5
|
5.3
|
30.7
|
32.8
|
1.1
|
26.7
|
9
b. Kingsgrove Road/William Street to Carillon Ave (10.36 km)
|
20.9
|
3.7
|
29.7
|
25.6
|
7.0
|
24.3
|
10
c. Broadarrow Road to Carillon Ave (15.56 km)
|
29.4
|
5.8
|
31.8
|
35.8
|
2.2
|
26.1
|
1. Excluding Monday - Forest Road to
King Georges Road not surveyed
2. Taren Point to Surry Hills
3. Brighton-Le-Sands to Surry Hills
4. Sylvania to Darlington
5. Rockdale to Darlington
6. Peakhurst to Redfern
7. Bexley to Redfern
8. Riverwood to Newtown
9. South Belmore to Darlington
10. Riverwood to Darlington
King Georges Road not surveyed
2. Taren Point to Surry Hills
3. Brighton-Le-Sands to Surry Hills
4. Sylvania to Darlington
5. Rockdale to Darlington
6. Peakhurst to Redfern
7. Bexley to Redfern
8. Riverwood to Newtown
9. South Belmore to Darlington
10. Riverwood to Darlington
-61-
are more or less comparable. The
northern extremities of these route
sections are located between 2 km
and 3 km radially from the City
while the southern extremities are
located between 10 km and 12 km.”
The Study includes a useful diagram which compares
the Southern routes with certain major arteries
elsewhere in Sydney (Warringah Road, Eastern Arterial
Road, Pacific Highway and Victoria Road). The
southern routes have better average speeds. The
diagram is included in this Report. (Figure 7).
the Southern routes with certain major arteries
elsewhere in Sydney (Warringah Road, Eastern Arterial
Road, Pacific Highway and Victoria Road). The
southern routes have better average speeds. The
diagram is included in this Report. (Figure 7).
The survey monitored the travel times from the out-
skirts of the City to almost the very centre. The
journeys range in length from 9 kilometres to 22
kilometres. The time varied between 46 minutes (at
the height of the peak for a 19 kilometre journey
from Peakhurst to Redfern) to 16.5 minutes for a
9 kilometre journey from Rockdale to Darlington
at 6.45 a.m.
Several things can be said. First, in terms of
relativities, the journey times and journey speeds
in the Southern metropolitan area compare favourably
with the rest of Sydney. Secondly, the time it takes
to travel from an outer suburb to the centre of the
City at the height of the peak is not appallingly
bad, even though there may be room for improvement.
2.3 Transportation System Management Survey 1978
The submission by the Department of Main Roads
included three diagrams. They are important and
they are reproduced here (37):
Figure 8: Sydney a.m. peak congestion
Figure 9: Sydney p.m. peak congestion
Figure 10: Sydney off-peak congestion
37. S.K/C
340 Submission DMR Transport & Economic
Analysis, pages 8-10.
Analysis, pages 8-10.
-62-

-63-
FIGURE 8.
FIGURE 8.

-64-
FIGURE 9.

-65-
FIGURE 10.

-66-
The diagrams were taken from a Study commissioned
by the Traffic Authority entitled ‘Transport
System Management' (38). They were
compiled by traffic engineers from the Department
of Main Roads. They are based upon the subjective
impressions of those engineers.
by the Traffic Authority entitled ‘Transport
System Management' (38). They were
compiled by traffic engineers from the Department
of Main Roads. They are based upon the subjective
impressions of those engineers.
They provide an invaluable guide to the location
and extent of congestion region-wide. Although
certain residents in Rockdale and elsewhere may
have gained the impression that their suburbs were
under siege, they are not as badly off as some.
and extent of congestion region-wide. Although
certain residents in Rockdale and elsewhere may
have gained the impression that their suburbs were
under siege, they are not as badly off as some.
The point can be made in another way. As part of
the Transport System Management Study a unit was
developed, known as the Congestion Assessment Unit
(C.A.U.) to provide 'an objective measure of
performance of each site'. The study explains (38):
the Transport System Management Study a unit was
developed, known as the Congestion Assessment Unit
(C.A.U.) to provide 'an objective measure of
performance of each site'. The study explains (38):
"The C.A.U. value was obtained
from the
congestion shown in figures (8, 9 and 10) by:
congestion shown in figures (8, 9 and 10) by:
(a) measuring the length of the
queue on the map(b) applying a factor of one if
the congestion was severe
and half if the congestion
was shown as moderate(c) multiplying by the number of
lanes on the approach to the
problem site.(d) the C.A.U.'s were then
obtained by adding the figures
so obtained on all approaches
to the site during all three
time periods."
The C.A.U. is no more than an approximation. The
Study says this (38):
Study says this (38):
"The C.A.U. is an arbitary
unit
developed solely for ease of appli-
cation. It is a measure of queue
rather than delay. These features
do not detract from its use as a
developed solely for ease of appli-
cation. It is a measure of queue
rather than delay. These features
do not detract from its use as a
38. Transport
System Management by Stapleton
Transportation Pty. Limited, page 3-3.
Transportation Pty. Limited, page 3-3.
-67-
measure of performance at the
metropolitan level, where a cheap
easy measure is sought rather
than a precise one."
The Study examined 188 sites. The average score
was 4.86. The range can be appreciated from the
following table (39):
was 4.86. The range can be appreciated from the
following table (39):
TABLE 2.
C.A.U.
VALUES
Site C.A.U. Value
Sydney Harbour Bridge 41.50
Junction of Parramatta Road
and Crystal Street, Leichhardt 22.75
Junction of Parramatta Road
and Crystal Street, Leichhardt 22.75
Junction of Church Street and
Barney Street, Parramatta 8.50
Junction of Marrickville Road
and Illawarra Road, Marrickville 0.25
Barney Street, Parramatta 8.50
Junction of Marrickville Road
and Illawarra Road, Marrickville 0.25
As part of the Study intersections were divided
into classes depending upon the C.A.U. value (40):
TABLE 3.
CLASS
|
C.A.U. VALUE
|
No. OF
INTERSECTIONS |
SYMBOLS ON FIGURE 11
|
(i)
|
Over
15.25
|
8
|
large red dot
|
(ii)
|
11.25-15.00
|
11
|
red circle
|
(iii)
|
6.25-11.00
|
26
|
red dot
|
(iv)
|
4.75-6.00
|
19
|
black circle
|
(v)
|
0-4.50
|
124
|
black dot
|
TOTAL INTERSECTIONS: 188
|
|||
39. T.S.M. ibid.,
page 3-4.
40. T.S.M. ibid., page 3-9.
40. T.S.M. ibid., page 3-9.
-68-
The sites were then plotted on a map. The map is
reproduced in this Report (Figure 11).
reproduced in this Report (Figure 11).
Appendix 2 to this Report is the table from this
Study. It covers all the 188 intersections examined.
The worst 45 were ranked according to the C.A.U.
value. Few from the Study Area were within the
‘worst 45’.
Study. It covers all the 188 intersections examined.
The worst 45 were ranked according to the C.A.U.
value. Few from the Study Area were within the
‘worst 45’.
Finally, we reproduce two further diagrams. They
will assist in determining questions of priority.
They place the congestion of the Study Area in a
regional perspective (41):
will assist in determining questions of priority.
They place the congestion of the Study Area in a
regional perspective (41):
- Figure 12 Major Queuing on Arterial
Roads. - Figure 13 Major Queuing Related to
Retail Centres.
The latter diagram identifies the Bexley and Rockdale
shopping centres as suffering from traffic queuing.
The Inquiry witnessed the difficulties of the Bexley
shopping centre created by traffic and traffic noise.
One submission had this to say (42):
shopping centres as suffering from traffic queuing.
The Inquiry witnessed the difficulties of the Bexley
shopping centre created by traffic and traffic noise.
One submission had this to say (42):
"..Bexley used to be a
pleasant place
to shop. You were able to converse
with the local shopkeepers in a
rational tone of voice and while at
the Barber’s, quietly speculate on the
chances of the Dragons on Saturday
next. Crossing over Forest Road at
the lights could be done in a leisurely,
dignified manner befitting one’s age.
For be it known a good percentage of
our residents are charitably known as
'Senior Citizens'.
Now, alas, those tranquil times are
no more. Semi-trailers, trucks and
yet more trucks pass along Forest Road,
through Bexley shopping centre, hour
after hour after hour. Far from being
able to converse with the shopkeepers,
one has to scream at the top of one’s
voice to make known your requirements.
The time is not far distant when
no more. Semi-trailers, trucks and
yet more trucks pass along Forest Road,
through Bexley shopping centre, hour
after hour after hour. Far from being
able to converse with the shopkeepers,
one has to scream at the top of one’s
voice to make known your requirements.
The time is not far distant when
41. T.S.M.
ibid., figures 3.1 and 3.12 respectively.
42. Submission S.K/C 083 Mr. Donald Robertson.
42. Submission S.K/C 083 Mr. Donald Robertson.
-69-
FIGURE 11
Queuing
sites by five classes

-70-
FIGURE 12
Major
Queuing on arterial roads

-71-
FIGURE 13
Major
queuing related to retail centres

-72-
communication will only be
established
by sign language or lip-reading. As
for crossing over the pedestrian walk
at the traffic lights, this is not a
venture to be undertaken 1ightly"..."
by sign language or lip-reading. As
for crossing over the pedestrian walk
at the traffic lights, this is not a
venture to be undertaken 1ightly"..."
The diagrams from this Study were prepared some
two years ago. The following question was put to
Mr. John Bliss from the Department of Main Roads,
he being the Traffic Engineer concerned with the
Study Area (43):
two years ago. The following question was put to
Mr. John Bliss from the Department of Main Roads,
he being the Traffic Engineer concerned with the
Study Area (43):
"COMMISSIONER: The diagrammatic
representation in these figures
(i.e., Figures 8, 9 & 10 of this
Report), are they reasonably accurate
for today's conditions?
representation in these figures
(i.e., Figures 8, 9 & 10 of this
Report), are they reasonably accurate
for today's conditions?
BLISS: I would
think so. I do
not think there have been any
dramatic changes."
not think there have been any
dramatic changes."
2.4 The Joint Study Report
The Joint Study Report was prepared for this Inquiry.
It had this to say on the question of congestion (44):
"Traffic congestion is wide-spread
throughout the Study Area during
peak and off-peak daytime periods."
Pausing there, the material from 'Transport System
Management’ suggests this statement is less than
accurate. There certainly is congestion, and it is
widely scattered, but it could hardly be called
'widespread throughout the Study Area during peak
and off-peak daytime periods'. The Joint Study
Report goes on (45):
Management’ suggests this statement is less than
accurate. There certainly is congestion, and it is
widely scattered, but it could hardly be called
'widespread throughout the Study Area during peak
and off-peak daytime periods'. The Joint Study
Report goes on (45):
"In terms of congestion,
relative to
that experienced elsewhere in the
Sydney Region, some of the more
critical locations are as follows:
that experienced elsewhere in the
Sydney Region, some of the more
critical locations are as follows:
- Princes Highway in the Tempe-St.
Peters area and on Canal Road,
St. Peters.- Railway road and Unwins Bridge
Road in the Sydenham area.
43. D.M.R.
Transcript 30/11/79, page 19.
44. Joint Study Report, page 3-4.
45. ibid., page 3-4
44. Joint Study Report, page 3-4.
45. ibid., page 3-4
-73-
- Princes Highway in the Rockdale-
Arncliffe area. - West Botany and Marsh Streets
area at Arncliffe. - Forest Road-Stoney Creek Road-
Bexley Road area at Bexley. - Homer Street-William Street-
Hartill Law Avenue at Bardwell
Park. - Canterbury Road, particularly
between River Road and Punchbowl
Road and through Canterbury.
Beamish Street at Campsie. - Hume Highway through Ashfield
shopping centre. - Hume Highway between Greenacre
and Yagoona.”
In the Inquiry’s observation the following areas
are perennially overworked:
are perennially overworked:
- Forest Road-Stoney Creek Road-
Bexley Road at the Bexley Shopping
Centre. - Forest Road-Princes Highway-Wickham
Street, Arncliffe. - In the morning peak the Princes
Highway especially on the approach
to Canal Road. - Canal Road especially at the
intersection of Kent Street,
Alexandria.
2.5 The Submissions to the Inquiry
The Inquiry received a vast number of submissions.
They varied in their assessment of traffic conditions.
Some did not look upon traffic as a significant
problem. Mr. Fraser, a resident of Dulwich Hill,
mad
They varied in their assessment of traffic conditions.
Some did not look upon traffic as a significant
problem. Mr. Fraser, a resident of Dulwich Hill,
mad
e the following submission (46):
"We note that the brochure
(referring
to the brochure circulated in the
Study Area) does not state the purpose
of the road and we request the purpose
be made public.
to the brochure circulated in the
Study Area) does not state the purpose
of the road and we request the purpose
be made public.
46. S.K/C
1255 Mr. M. Fraser.
-74-
If the road is required primarily
for dispersion of local traffic,
as local residents we would like
to question this, as we are not
aware of any real traffic problems.
for dispersion of local traffic,
as local residents we would like
to question this, as we are not
aware of any real traffic problems.
The Canterbury Municipal Council opposed all options.
In its submission it said (47):
In its submission it said (47):
"Council contends that the
demand
for any route is not satisfactorily
documented or established."
for any route is not satisfactorily
documented or established."
It went on (48):
"Canterbury Council is opposed
to all
major road proposals as presently
stated in the Kyeemagh/Chullora Report
and suggests the upgrading of existing
routes, improved traffic management
and further development of alternative
modal forms as a solution to the
regional transport problem."
major road proposals as presently
stated in the Kyeemagh/Chullora Report
and suggests the upgrading of existing
routes, improved traffic management
and further development of alternative
modal forms as a solution to the
regional transport problem."
Others took a contrary view. A resident of Forest
Road, Arncliffe had this to say (49):
Road, Arncliffe had this to say (49):
"At morning and afternoon peak
periods
the volume of traffic is approaching
peak conditions. With the normal
increase in motor vehicles the position
will shortly be worsened. During these
periods it is difficult for a pedestrian
to safely cross the road and generally
quite a period of waiting is necessary.
...I consider that it is essential for
a completely new road to be constructed
to provide access for most traffic to
the South-West and the Western areas..."
The view of the N.R.M.A. is well known. It emerges
from the first page of its submission. It is in the
following terms (50):
from the first page of its submission. It is in the
following terms (50):
"The N.R.M.A. is deeply concerned with
the leve1s of congestion experienced by
current road users travelling through
suburbs south of the city and is
particularly concerned with the potential
the leve1s of congestion experienced by
current road users travelling through
suburbs south of the city and is
particularly concerned with the potential
47. S.K/C
341 Canterbury Municipal Council Submission
page 47.
48. ibid., page 1 Summary.
49. Submission S.K/C 842 A.J Baldwin letter 20/7/79.
page 47.
48. ibid., page 1 Summary.
49. Submission S.K/C 842 A.J Baldwin letter 20/7/79.
50. S.K/C
684 Submission N.R.M.A. 18/7/79.
-75-
increase in traffic due to the develop-
ment of Port Botany and increasing demand
for travel through Sydney Airport. The
plight of motorists has been worsened
by the very slow development of traffic
corridors through the area."
ment of Port Botany and increasing demand
for travel through Sydney Airport. The
plight of motorists has been worsened
by the very slow development of traffic
corridors through the area."
A very persuasive and readable submission was lodged
by the Arncliffe Progress Association. It was later
supported by oral evidence given by Alderman Austin
and Alderman Wright of the Rockdale Municipal Council (51).
The submission reads in part:
by the Arncliffe Progress Association. It was later
supported by oral evidence given by Alderman Austin
and Alderman Wright of the Rockdale Municipal Council (51).
The submission reads in part:
"Traffic problems in the
Second Ward
of Rockdale Municipality are already
severe, particularly in Forest Road
where the inadequacy of the system to
cope with existing traffic is displayed
by the excessive queues which form at
Bexley, Princes Highway and Marsh Street.”
of Rockdale Municipality are already
severe, particularly in Forest Road
where the inadequacy of the system to
cope with existing traffic is displayed
by the excessive queues which form at
Bexley, Princes Highway and Marsh Street.”
2.6 The Submission from the Department of Main Roads
The Department of Main Roads identified three ways
in which the strain upon the existing road network
might be demonstrated. They were:
in which the strain upon the existing road network
might be demonstrated. They were:
- First, the subjective assessments
of traffic engineers.
- Secondly, a technique employing
what are termed “Y” values.
- Thirdly, a technique using 'screen-
line' analysis.
We have referred already to the subjective assessments
of traffic engineers (52). We will concentrate in this
section upon the other techniques.
of traffic engineers (52). We will concentrate in this
section upon the other techniques.
It is commonplace to hear traffic engineers refer to
intersections as the 'weak link in the chain’.
Traffic moves reasonably smoothly from one intersection
to the next. The queues develop when cross traffic
must be accommodated at an intersection. The 'Y value'
intersections as the 'weak link in the chain’.
Traffic moves reasonably smoothly from one intersection
to the next. The queues develop when cross traffic
must be accommodated at an intersection. The 'Y value'
51. Transcript
25/10/79.
52. See pages 64 to 66.
52. See pages 64 to 66.
-76-
analysis concentrates upon intersections to identify
those operating at or close to saturation. The
following definition of 'Y’ is provided by the
Department of Main Roads (53):
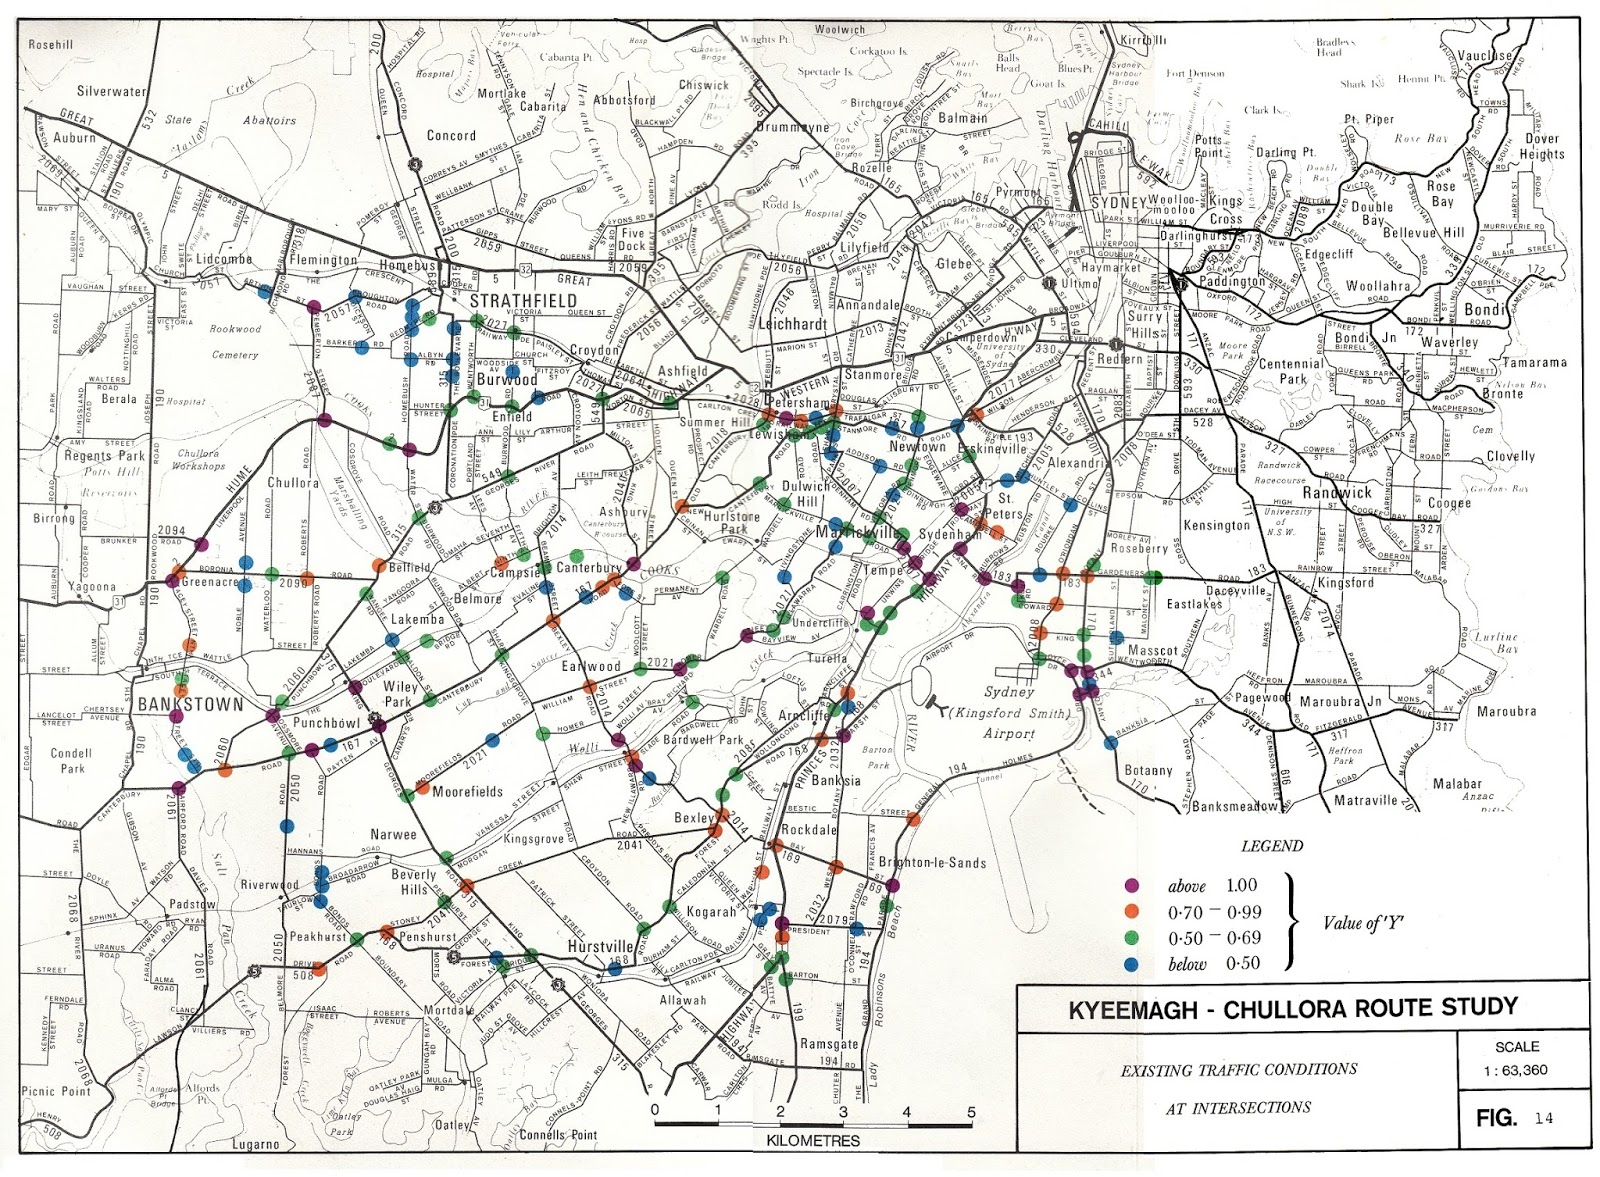
"..'Y'..is determined from the
ratios,
of arrival rates to saturation flows
for each approach to the intersection,
(and) gives a measure of the degree
of saturation. The upper limit of 'Y'
for the efficient operation of that
intersection varies, but would be in
the range of 0.70 to 0.85. Under these
conditions queues at signals would be
cleared most of the time in one phase."
The Department provided a diagram of the Study Area
representing 182 intersections. It is reproduced
here (Figure 14). The analysis revealed:
representing 182 intersections. It is reproduced
here (Figure 14). The analysis revealed:
- 65 intersections had “Y” values
above 0.70 and most of these could
be considered as badly over-saturated
- A further 65 intersections showed
“Y” values approaching 0.70.
Screenline analysis compared the number of vehicles
using a 'major movement corridor' with the available
road capacity in that corridor. A volume/capacity
ratio can be calculated. It reveals at a glance the
degree to which there is spare capacity within a
corridor. It also gives an indication of the level of
congestion. The Department says this (54):
"Using a volume/capacity ratio
of 0.80
to represent congested conditions, it
is seen that the screenlines in the
vicinity of the airport (1 and 3) are
seriously overloaded. The Bankstown
screenline (10) is very close to overall
saturation, and the other screenlines
are approaching overall saturation or
suffering congestion. "
to represent congested conditions, it
is seen that the screenlines in the
vicinity of the airport (1 and 3) are
seriously overloaded. The Bankstown
screenline (10) is very close to overall
saturation, and the other screenlines
are approaching overall saturation or
suffering congestion. "
53. D.M.R.
Submission S.K/C 340 Economic and
Transport Analysis, page 7.
54. D.M.R. Submission ibid., pages 7 and 13.
Referring to Figure 15 reproduced on page
80 of this Report.
Transport Analysis, page 7.
54. D.M.R. Submission ibid., pages 7 and 13.
Referring to Figure 15 reproduced on page
80 of this Report.
-77-
FIGURE 14.
(i.e.,
Figure 3.4 of Economic and Transport
Analysis showing “Y” values)
Analysis showing “Y” values)
-78-
Figure 15 reproduces from the Department's
submission a diagram indicating the volume/capa-
city ratios in the 1976 a.m. peak across selected
screenlines.
submission a diagram indicating the volume/capa-
city ratios in the 1976 a.m. peak across selected
screenlines.
The screenline analysis must be used with caution
The Department says this (55):
The Department says this (55):
"A disadvantage of screenline
analysis
is that it is often difficult to
select screenlines without including
some minor routes which are under-
utilised on account of their being
inappropriate for major traffic flows
or it not being possible to feed them
adequately. In such cases (for example,
screenlines 7, 8 and 9 in Figure 15)
the volume/capacity ratio across the
whole screenline will not necessarily
be a good indication of congestion
levels on the major routes. A further
problem is that the points where the
screenlines cross major routes may not
be representative of those routes in
terms of their operating conditions,
and sections of serious congestion
may not be included. Thus screenline
analysis can be useful but caution
needs to be exercised in interpreting
the results.”
2.7 Evidence Before the Inquiry
Mr. John Bliss is a Traffic Engineer employed by
the Department of Main Roads. He gave valuable
evidence before the Inquiry (56). He provided the
Inquiry with a map (57) depicting areas of congestion
and identifying 'short-cuts, where traffic filters
through residential areas to avoid congested links.
the Department of Main Roads. He gave valuable
evidence before the Inquiry (56). He provided the
Inquiry with a map (57) depicting areas of congestion
and identifying 'short-cuts, where traffic filters
through residential areas to avoid congested links.
The map is too large (and the network too detailed)
to reproduce in this Report. It confirms (and
amplifies) the material emerging from Figures 8, 9
and 10. The following sites were identified as
areas of congestion:
to reproduce in this Report. It confirms (and
amplifies) the material emerging from Figures 8, 9
and 10. The following sites were identified as
areas of congestion:
55. ibid.,
page 13.
56. D.M.R. Transcript 30/11/79, page 19.
57. Exhibit 63.
56. D.M.R. Transcript 30/11/79, page 19.
57. Exhibit 63.
-79-

-80-
- The Grand Parade between Bay Street,
Rockdale and Bestic Street.
- A portion of General Holmes Drive
from Bestic Street to Tancred
Avenue, Kyeemagh.
- The junction of Forest Road and
Princes Highway.
- Wickham Street, Arncliffe and the
intersections at either end.
- The Rockdale shopping centre.
- The Bexley shopping centre (Forest
Road)
- The Bexley North shopping centre.
- The Kingsgrove shopping centre.
- The Campsie shopping centre.
- Canterbury Road between the Cooks
River and King Georges Road.
- Canterbury Road near Punchbowl
Road extending as far as Clements
Avenue, Bankstown.
The back street 'short-cuts' (colloquially called
‘rat runs’) include:
‘rat runs’) include:
- Ponyara Street and Coolangatta
Road to Moorefields Road, Beverly
Hills.
- Various streets by-passing the
Bexley shopping centre (via
Reginald Street to Bexley Road).
- A number of streets in the Arncliffe
area where traffic seeks to avoid
the congestion at the junction of
Forest Road, Princes Highway and
Wickham Street.
- A number of streets in Rockdale
(Francis Street, Moate Avenue,
Beehag Street and Tancred Avenue
where traffic seeks to avoid the
congestion in Grand Parade and
General Holmes Drive).
- Yerrick Road and Moreton Street,
Lakemba.
- Second Avenue, Loch Street and
Evaline Street, Campsie.
- Woolcott Street, Spark Street,
Hamilton Avenue, Earlwood
- Various roads in the Bardwell
Park area.
The Inquiry is not in a position to say whether it
is feasible (and the extent to which it is possible)
to close off these by-passes or make them less
attractive by means of traffic management and a
road hierarchy. The Canterbury Council takes the
view that this is the better course. It has embarked
upon a scheme of establishing residential precincts
designed to force through-traffic back onto arterial
roads (58).
2.8 The Inquiry's Conclusion
The following emerges from this material:
- The URTAC Report of 1976 did not
identify the Study Area as being the
most severely congested. It thought
there were pockets of congestion in
the southern and inner western suburbs.
- The NRMA travel time and travel speed
surveys compare the southern metropo-
litan routes favourably (by a slight
margin) with other routes in Sydney.
The NRMA suggests that the other routes
are hardly a reliable guide because
they themselves are inadequate. In
terms of priorities, nonetheless, the
comparison is instructive.
- Of especial interest are the surveys
made in 1978 in connection with the
Transport Systems Management studies.
The area of concern to this Inquiry is
not demonstrably worse than many other
areas of Sydney. Indeed, with some
important exceptions, it is demonstrably
better.
- The relativities emerge clearly from
Appendix 2 to this Report, the Table
of Congestion Assessment Units.
58. Transcript
2/11/79, Canterbury Municipal Council,
page 30. See Volume II Transport Criteria, page 111.
page 30. See Volume II Transport Criteria, page 111.
- We do not underestimate the important
exceptions where traffic is a very real
problem. Forest Road is over-worked
having regard to its width and character.
Bexley shopping centre on Forest Road is
hardly enticing. Noise, especially from
heavy vehicles, can reach intolerable
levels. The junction of Princes Highway,
Forest Road and Wickham Street, Arncliffe
is constantly under strain and queues are
commonplace in the peak. Canterbury Road
is heavily trafficked, especially by
trucks. Severe congestion was evident
from our inspections (including one from
a helicopter) in the vicinity of Bankstown
extending from Chapel Road to Stacey Street.
The important point, however, is that congestion is
not 'widespread' (contrary to the suggestion made in
the Joint Study Report). Rather it is confined to
specific locations.
not 'widespread' (contrary to the suggestion made in
the Joint Study Report). Rather it is confined to
specific locations.
When assessing each option it will be important to
examine (inter alia) whether the options address the
'sore spots'. It is all very well to subtract traffic
here there and everywhere. The reduction in traffic
may be welcome where it occurs, but it is rather
inefficient if there is already spare capacity in
the link from which it is withdrawn. Rather, it is
important that the option should address those links
and those intersections already over-worked. It
should reduce their load so that they may work
rather better and make the system, overall, rather
more efficient.
This, then, is the present traffic position. What
of the future? We will address that issue separately
in the following chapter.
of the future? We will address that issue separately
in the following chapter.
Go to Chapter IV -->